AGP Reports


CGM AGP Report (Continuous Glucose Monitor) - v5.0

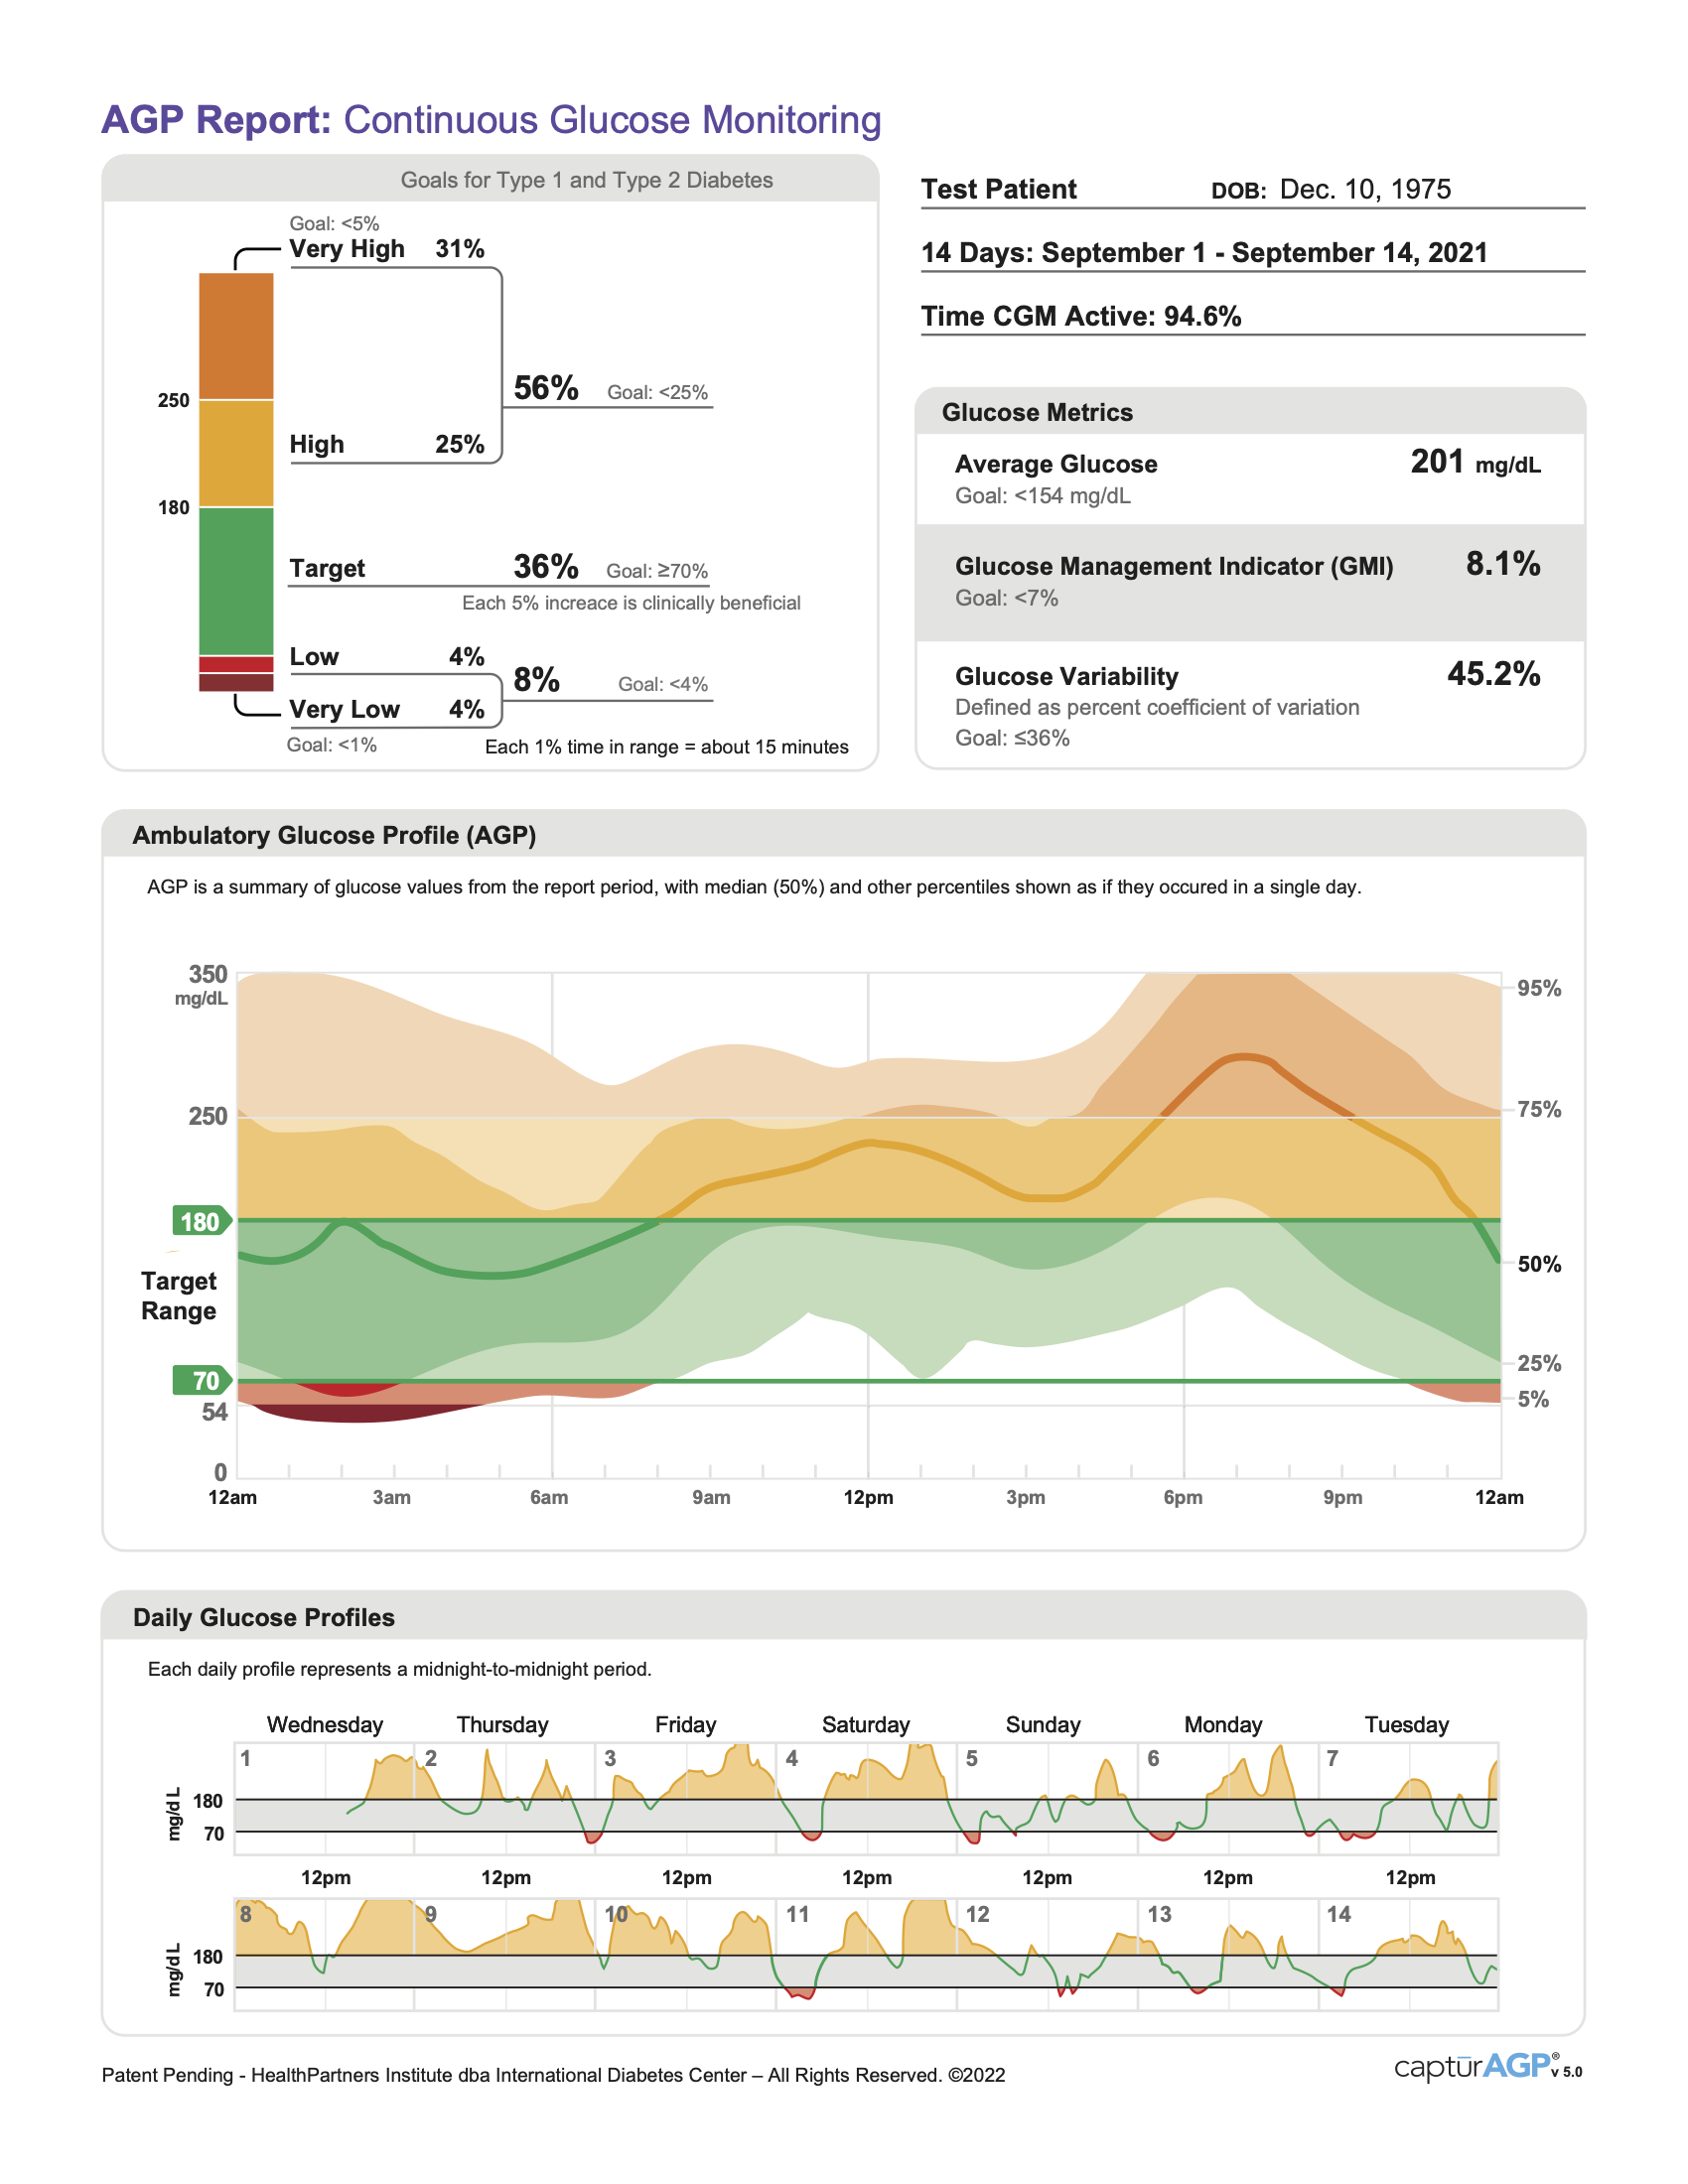
Time in Ranges:
[shown in % of device readings and in hours/minutes of a 24 hours day]
- Time in Target: Ideally, glucose values are in target range
- Low/Very Low: Goal - few very low or low values; reducing lows will make you feel better
- High/Very High: Goal - few very high or high values; reducing highs will make your A1c lower over time

Glucose Statistics and Targets:
Dates & number of days in report
Percent Time CGM Active: Hours the CGM collected data, divided by number of hours in report
Glucose Ranges and Targets: For people with diabetes, this table shows the goal in both % of device readings and in hours/minutes of a 24 hours day that are the targets (closer to these is better)
Avg. Glucose (mean): All glucose values added together, divided by number of readings
GMI (glucose management indicator): Calculated from average glucose; estimates your future lab A1c
Glucose Variability: How far apart (wide) glucose values are; ideally a low number equal to or less than 36% [percent coefficient of variation]


Glucose Profile: Daily glucose profiles are combined to make a one day (24-hour) picture. Ideally, lines would stay within green outlined area (target range)
Heavy line: median (middle) line where half of the glucose values are above and half are below; ideally, the line is mostly flat and inside the green Target range area 70-180 mg/dL
Darker shading: area shaded darker shows 50% of the glucose values; ideally, space between is narrow
Lighter shading: 5% of values are above (95% top line) and 5% are below (5% bottom line); ideally, the closer the light shaded area is to the darker shaded area, the better

Daily Glucose Profiles: Each box is a single day's glucose pattern. If readings are:
- Above the shaded area - yellow (high); could make it harder to heal from infections and over time causes complications
- Below the shaded area - red (low); could make you feel shaky, weak or confused

SMBG AGP Report (Self Monitoring Blood Glucose) v5.0

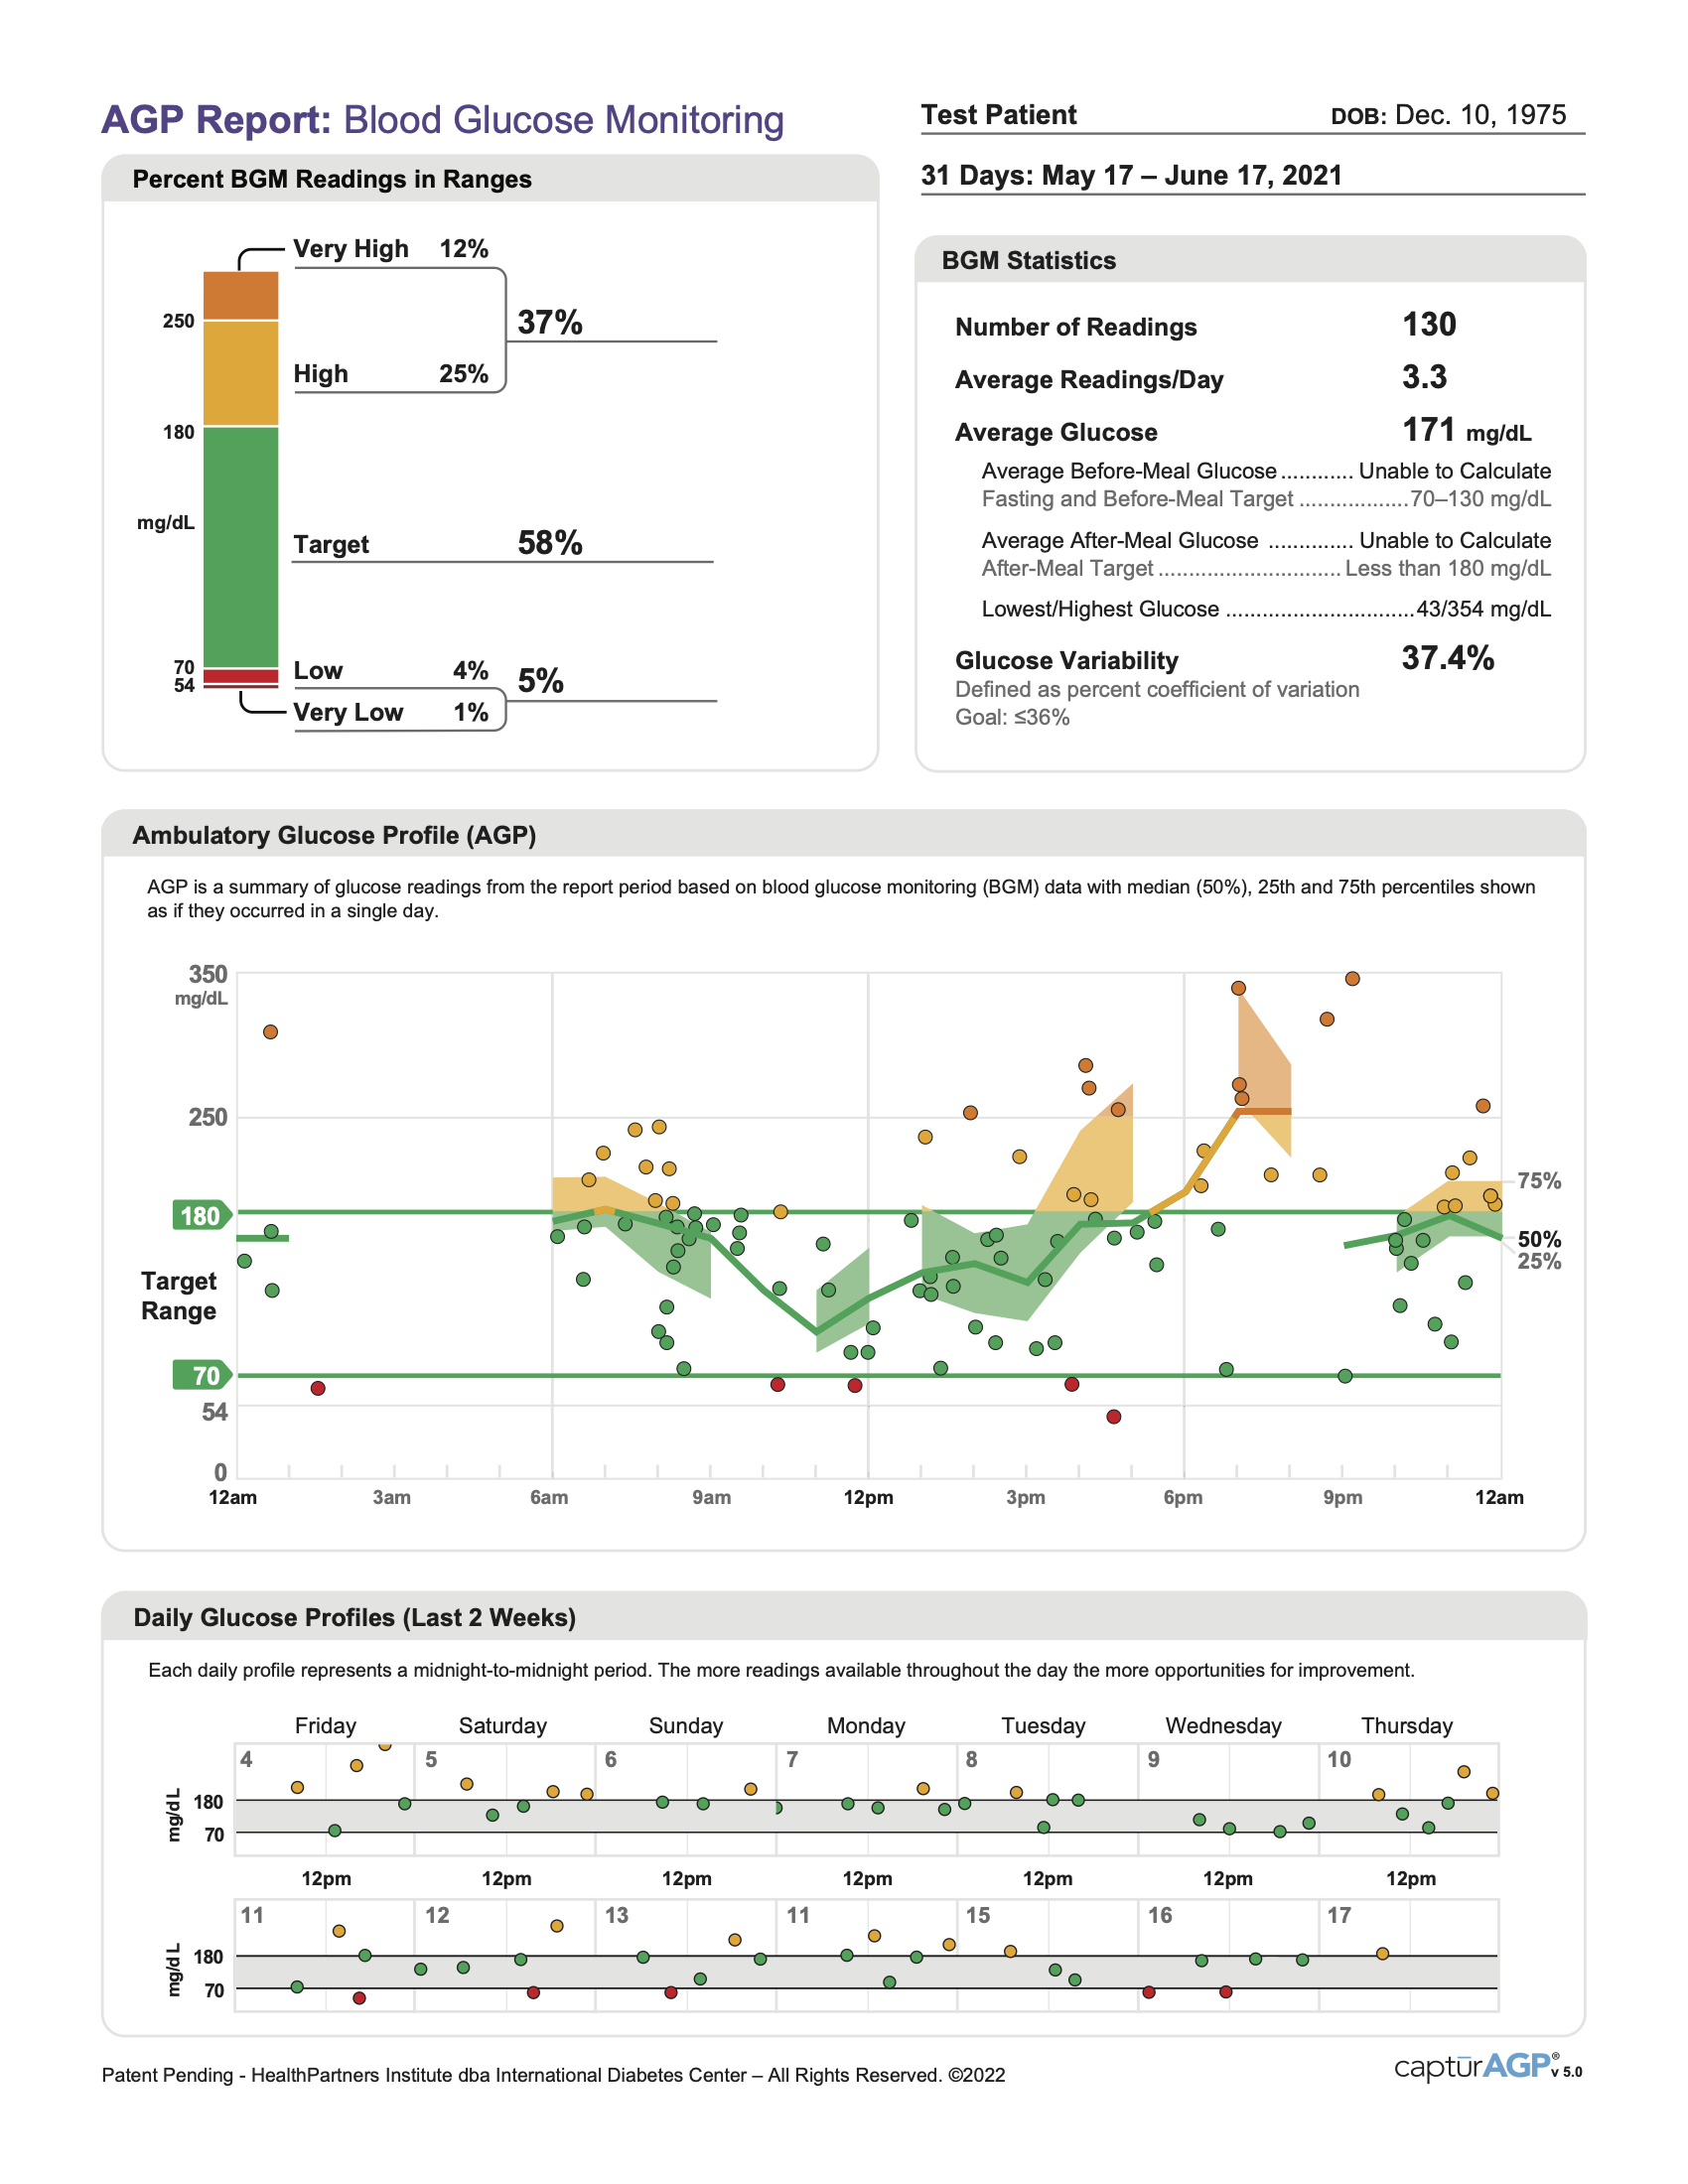
Time in Ranges:
- Time in Target: Ideally, glucose values are in target range
- Low/Very Low: Goal - few very low or low values; reducing lows will make you feel better
- High/Very High: Goal - few very high or high values; reducing highs will make your A1c lower over time

Glucose Statistics:
Dates & number of days in report
Number of Readings: Total number of finger sticks on the report
Average Readings per Day: Number of finger sticks, divided by days in report
Avg. Glucose (mean): All glucose values added together, divided by number of readings
CV (Coefficient of Variation): How far apart (wide) glucose values are; ideally a low number

Glucose Profile: Daily glucose profiles are combined to make a one day (24-hour) picture. Ideally, lines would stay within green outlined area (target range)
Heavy line: median (middle) line where half of the glucose values are above and half are below; ideally, the line is mostly flat and inside the green Target range area 70-180 mg/dL
Darker shading: area shaded darker shows 50% of the glucose values; ideally, space between is narrow
Lighter shading: 5% of values are above (95% top line) and 5% are below (5% bottom line); ideally, the closer the light shaded area is to the darker shaded area, the better

Daily Glucose Profiles: Each box is a single day's glucose pattern. If readings are:
- Above the shaded area (high); could make it harder to heal from infections and over time causes complications
- Below the shaded area (low); could make you feel shaky, weak or confused